
Teams of students work collaboratively to design 3D bridge models and then print and test them.
Individual students will use West Point Bridge Design program to design a bridge that can span a minimum of 6.75″ and weigh no more than 20 grams. The best most efficient bridge wins the live tournament.
Main Event
Event Description
In this event, teams of 2-4 students will design a bridge, virtually test it, and then print it on a 3D printer. Teams will then bring their bridges to the tournament to see which will have the highest structural efficiency. Teams will also submit a Design Document outlining some of the key aspects of the process.
Design Documents must be converted to a PDF file before uploading to the TOT Project Submission Portal no later than 10:00 pm, March 15, 2024.
Common Core Standards and 4 C’s
Use technology, including the Internet, to produce and publish writing and present the relationships between information and ideas clearly and efficiently. Creativity, Collaboration, Communication, and Critical Thinking.
Designing and Creating Your Project
The process of creating your project should take the following steps:
- Research different bridge structures to help design your bridge.
- Use West Point Bridge Design program to design and virtually test your bridge.
- Use a 3D program such as SketchupMake or Tinkercad to create a 3D model of your bridge.
- Print your bridge on a 3D printer.
- Test your bridge, make adjustments, and reprint (may repeat multiple times).
- Bring your bridge to the tournament to see which is the best.
Technical Requirements and Specifications
- The bridge must be completely drafted by the students. Bridges will be designed and printed prior to the competition, using West Point Bridge Design, 3D modeling software, and the MakerBot or Robo 3D Printers.
- The bridge must weigh no more than 30 grams.
- The bridge must be able to span a distance of 5.75 inches (146mm), from the center of the pier to the center of the next pier.
See the load test diagram below:
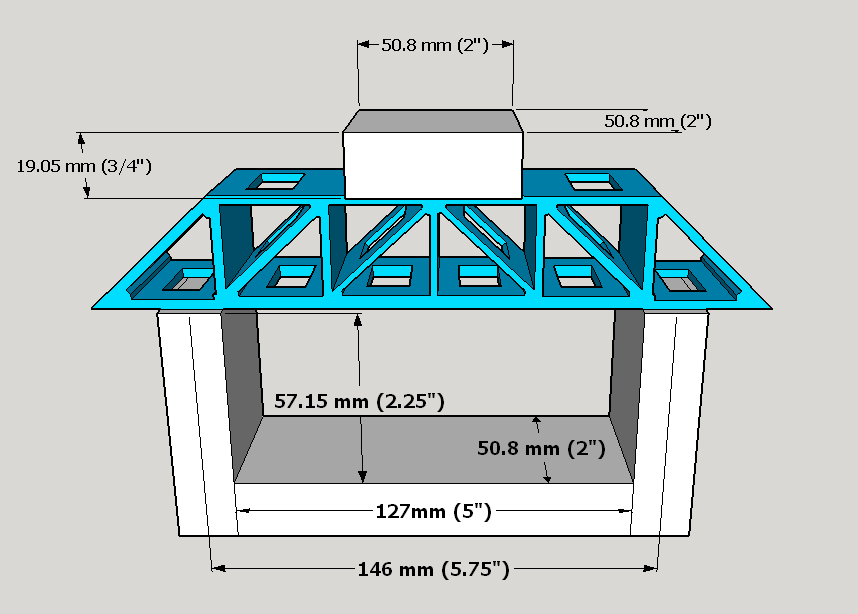
- The load plate will be 3” x 1 1/4” (78mm x 33mm) and will be placed on the top of the bridge.
- The bridge can be printed in one piece, or in components that may be glued together, but NO other materials may be used.
- Each team must also submit a Design Document by 10:00 pm March 15, 2024, to the TOT Project Submission Portal.
Reward Points
Teams will test their bridges on the day of the tournament. Each bridge will be loaded with weights until it fails. Its structural efficiency will be calculated by dividing the total load supported by the mass of the bridge. Then the bridges will be ranked by structural efficiency and the final points will be as follows:
| 3D Bridge Scoring Breakdown | ||
| Max Points | Formula | |
| Points from Rank | 35 | 35 – 3 (Your Rank -1) |
| Points from Structural Efficiency | 35 | First Place Efficiency / Team’s Efficiency x 35= Team’ Total Efficiency |
| Points from Design Document | 30 | See Design Document Rubric |
Design Document
Overview
Students will create a document outlining the process of designing and testing their bridge. There will be four main sections: Research, Specifications, Testing, and Conclusion. The document will be submitted and scored prior to the tournament and will be worth 30 points. Design Documents must be converted to a PDF file before uploading to the TOT App Submission Portal no later than 10:00 pm March 15, 2024.
Research
In this section, students will select a question or concept related to the project and use the internet or other sources to search for information and solutions.
Students may investigate their own question, or choose one from the list below:
- What are the benefits/limitations of different bridge structures?
- What roles do compression and tension play in a bridge structure?
- What makes a good bridge?
Specifications
In this section, students will list specific measurements of their bridge such as mass and dimensions. They will also include screenshots of their bridge from the West Point Bridge Design Program, the 3D model design stage as well as a picture of their final printed bridge.
Testing
Virtual Testing:
Students will explain how they designed and tested their bridge in the West Point Bridge Design program and what modifications they made to improve its structural efficiency. This could include minor adjustments such as increasing/decreasing the size of individual components; or major changes such as a complete redesign or use of a completely different structure.
Physical Testing:
Students will describe what modifications they made after testing their bridge past its breaking point. They should include a picture of the broken bridge and explain what changes were made to increase strength and prevent repeated failure.
Conclusion
In the last section, students will write a conclusion that summarizes the modifications to their final bridge. They will explain why they chose certain adjustments and modifications over others citing their testing and research.
Getting Help
Contact Robert Donat at Robert.Donat@fresnounified.org or Yvetter Eamigh Yvette.Eamigh@fresnounified.org if you have any further questions or suggestions regarding this future competition event.